Job Monitoring
Monitoring indicates how many resources are utilized by the job.
Features
Monitoring: In the Job details, there is a Monitoring to show resource consumption metrics.
Resources It monitors three kinds of resources: CPU, Memory and GPUs.
Configuration
It could be enabled or disabled from helm value (the feature is enabled by default)
jobSubmission:
  monitoring:
    enabled: true
Design
User Journey
Monitor the running job
A user submits a job and enter the job detail page.
In the job page, switch to Monitoring tab, it will show the current cpu/gpu/memory metrics for a given of time. The metrics keep updating every 10 seconds.
Click the different timespan (15min, 1hrs, 3hrs, lifetime) can switch to different timespan.
Once the job is completed, stop updating and show the final metric state.
See the metrics for completed job
Go to a completed job.
Go to the Monitoring tab.
It will show the latest cpu/gpu/memory metrics. And there are still different timespan to select.
See a warning when phfs is not enabled
In the monitoring tab, see the message "feature not enabled, please contact admin", if underlying prerequisite (phfs) is not enabled.
Architecture
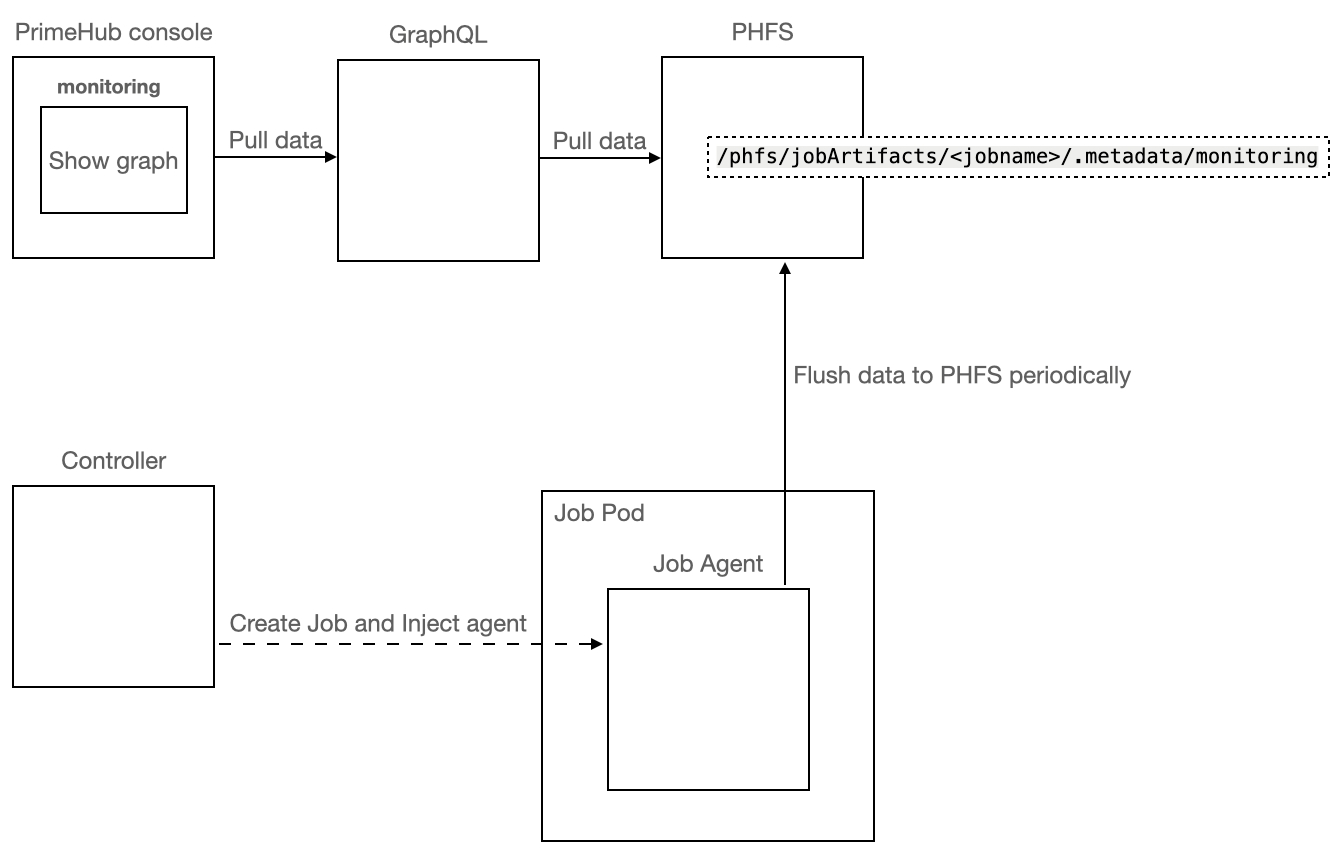
For every running job, there would be a agent to collect the cpu/gpu/memory metrics
Monitoring Page should refresh itself every 10 seconds.
The agent periodically flush the current report to
/phfs/jobArtifacts/<jobname>/.metadata/monitoring.The GraphQL has the report endpoint for the job to return current monitoring-report to client.
The console periodically queries GraphQL to get the current metrics of the job.
Components
Agent
Collect cpu/memory/gpu metrics.
Keep the different interval metrics in the memory.
Flush the monitoring metrics report to a file periodically (default
monitoringin working directory).
Controller
Inject the agent to the job container in the init container.
Run the agent at the start of the job in right working directory.
Terminate(kill) the agent on the command is terminated.
GraphQL
Query the report from store and return to client (add
monitoringfield in artifact resource)
Client
Query GraphQL and render report periodically when running.
Query GraphQL and render final report when completed.
Data Format
/phfs/jobArtifacts/<jobname>/.metadata/monitoring
There are 4 timespans
15m,1h,3handlifetimeEach timespan has its interval of freshness.
15m: 10s → 15 * 60 / 10 = 90 points
1h: 30s → 60 * 60 / 30 = 120 points
3h: 2m → 3 * 60 * 60 / 120 = 90 points
Lifetime: 5m → (4 weeks by default, configurable option in helm value)
examples
1 day → 24 * 60 * 60 / 300 = 288 points
4 week → 4 * 7 * 24 * 60 * 60 / 300 = 8064 points if 1 point uses 1k size, the bandwidth estimation will be 8064 / 1024 / 8 =
0.98 Mb/s